
Early seasonal sales show a cautious consumer, while the final shopping days will determine whether demand recovers before Halloween.
United States | Business News and Retail
Information checked on 25 October 2026.
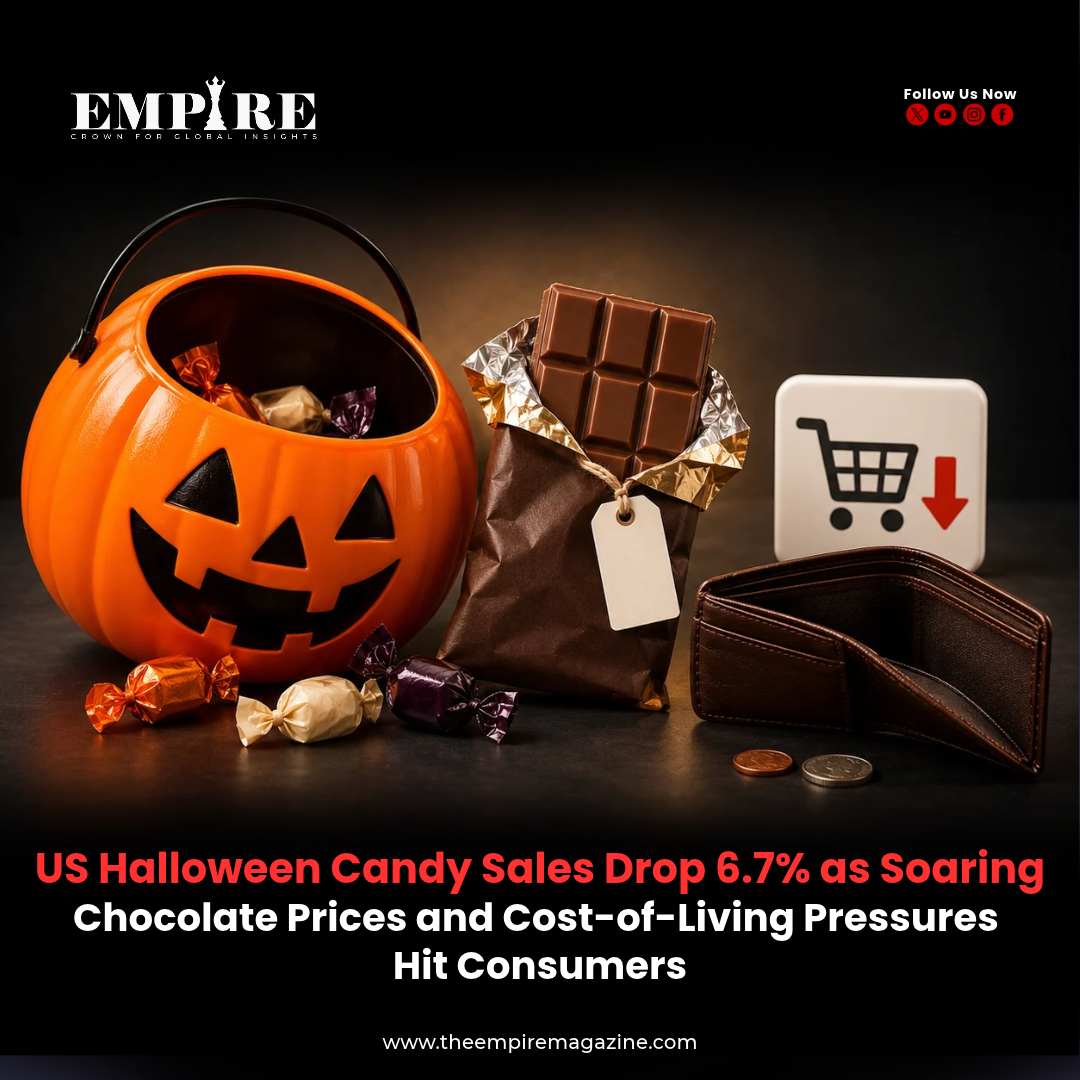
US Halloween candy sales fell 6.7% year on year in the month ending 17 October 2026, according to NielsenIQ figures reported by The Associated Press.
The result captures purchases before Halloween on 31 October. It provides an early signal of demand rather than a final measure of the season. For confectionery companies and retailers, the remaining shopping days will help establish whether households have delayed purchases or reduced what they intend to buy.
The business challenge is affordability. Candy is a familiar part of the celebration, but households still have to fit it into a budget that covers everyday necessities. Higher prices can change the amount people buy even when their interest in the holiday remains strong.
What the US Halloween Candy Sales Figures Reveal
A sales decline needs to be read alongside its reporting period and the measure being used. Revenue, the number of packages sold and the total weight purchased can move differently when prices and pack sizes change.
The headline figure alone does not establish the change in consumption or the final seasonal outcome. A separate dataset helps show why those distinctions matter.
Separate Retail Data Shows Falling Purchasing Volumes
In an analysis published on 21 October, Consumer Edge reported weaker candy demand in its Basketview dataset for 1–15 October 2026. Its year-on-year comparisons separated sales value, volume and average pricing.
| Category | Sales value | Volume | Average price per unit |
| Chocolate | −2.3% | −7.1% | +5.2% |
| Non-chocolate candy | −9.2% | −10.6% | +1.6% |
Source: Consumer Edge Basketview. Changes compare 1–15 October 2026 with the equivalent period in 2025.
Within that dataset, higher average prices partly offset lower purchasing volumes. Non-chocolate treats also experienced weaker demand, suggesting that the pressure extended beyond chocolate.
These figures cover a different period and dataset from the NielsenIQ result. They should be assessed separately rather than combined into one market-wide growth rate.
Candy Inflation Adds to Household Spending Pressure
The US Bureau of Labor Statistics reported that its candy and chewing gum consumer price index was 7.7% higher in September 2026 than a year earlier. This is a national category measure covering more than seasonal Halloween products; it does not describe the price increase for every chocolate brand.
That annual comparison helps explain why shoppers may find familiar treats harder to fit into their budgets. A lower rate of inflation in a later month would mean prices were increasing more slowly. It would not, by itself, mean that shelf prices had returned to previous levels.
The practical comparison for a shopper is therefore the price of the quantity they need. A bag with a lower ticket price may contain fewer pieces or less weight. Looking at those differences gives a clearer view of value than comparing the package price alone.
How Cocoa Supply Problems Feed Into Chocolate Prices
A September 2026 analysis from the Bureau of Labor Statistics traced earlier confectionery price increases to several supply pressures. Its review described weather damage, crop disease and weaker cocoa production in West Africa, including problems affecting Côte d’Ivoire and Ghana during the 2023–24 season.
Those historical disruptions help explain the cost increases that developed across the chocolate supply chain. They should not be read as a new estimate of the 2026 harvest.
The same analysis explains that cocoa buyers can arrange contracts up to 12 months ahead of a harvest. This creates a timing difference between movements in commodity markets and the costs passing through manufacturers.
A change in the traded price of cocoa therefore does not automatically produce an immediate, matching change in the price of a chocolate assortment. Cocoa is one input in a finished product that also has to be processed, packaged, transported and sold.
Consumers Plan Around Affordability
The National Retail Federation’s 2026 Halloween survey, conducted by Prosper Insights & Analytics, offers evidence of how consumers say they would respond to higher prices. Among respondents facing unexpectedly expensive Halloween products, 31% planned to compare prices and 26% planned to look for coupons or sales.
These survey intentions help explain the importance of perceived value.
A large pack can offer a competitive price per piece while requiring more money upfront. For someone working within a fixed spending limit, a smaller purchase may be easier to manage. That distinction helps explain why the cheapest unit price does not always produce the most accessible purchase.
Why Spending Forecasts and Early Sales Can Point in Different Directions
The NRF forecast put total 2026 Halloween spending at $13.5 billion, including an estimated $4.1 billion on candy. The broader total also covers purchases such as costumes and decorations.
A survey-based seasonal forecast and retail sales recorded during a specific month answer different questions. Neither should be substituted for the other. Spending can also rise in dollar terms because prices are higher, even when the quantity purchased does not increase.
Chocolate Still Has a Strong Place in Halloween Traditions
Separate research published by the National Confectioners Association in September identified chocolate as the leading Halloween treat in its survey, followed by gummy candy, hard candy and candy corn. It also reported that more than one-quarter of consumers buy Halloween treats before October.
The findings show why both product mix and timing matter. Enthusiasm for chocolate gives brands a reason to remain prominent in seasonal displays, while the wider range of treats gives households alternatives when planning their purchases.
Early shopping also makes a single late-October snapshot an incomplete account of the season. Comparisons need to cover equivalent periods and account for purchases made before the final rush.
The Retail Tradeoff Between Promotions and Profit
From a business perspective, the final days create a practical inventory decision. Retailers need enough stock for shoppers who buy close to Halloween, while limiting the quantity of dated seasonal products left afterwards.
A promotion can help sell stock, but a higher number of purchases does not necessarily mean a better financial result. The discount, the cost of the goods and any remaining inventory all affect the return.
Clear pack information can also influence the decision. Price per ounce, approximate piece count and the mix inside an assortment help shoppers judge whether an offer meets their needs. Different households may prioritise a lower checkout total, a preferred brand or enough pieces for the number of visitors they expect.
These are commercial considerations rather than confirmed changes in any named retailer’s strategy. The early sales result makes them relevant, but it does not show which promotional approach will work best.
What to Watch When US Halloween Candy Sales Are Complete
Post-holiday reporting will be more useful if it separates several measures.
| Measure | What it would help establish |
| Full-season sales | Whether later purchases offset the earlier weakness |
| Units and weight sold | How much candy shoppers actually bought |
| Average prices and promotions | How pricing influenced spending and margins |
| Pack sizes and product mix | Whether demand shifted between formats or types of treats |
For manufacturers, those details would help distinguish a temporary change in shopping timing from a more persistent affordability problem. For retailers, they would show whether sales were achieved at workable margins and with manageable leftover stock.
The next update on US Halloween candy sales will therefore matter most when it covers the full shopping period and explains the quantities behind the spending. Until then, the available evidence supports a cautious view of early demand while leaving the final seasonal result open.
Explore more global business, technology and innovation coverage in The Empire Magazine’s article archive.
Read our related coverage: anthropic-ai-agents-internet-access-tests/
Follow The Empire Magazine:
Facebook | Instagram
The Empire Magazine | Crown For Global Insights